
Price history charts: save money tracking product prices
Amazon changes prices on millions of products 2.5 million times daily, making that perfect deal you spotted this morning potentially obsolete by afternoon. Without understanding price history charts, shoppers rely on single price snapshots that rarely reflect true value. Mastering these charts transforms online shopping from guesswork into strategic savings, helping you identify genuine discounts and avoid manipulative pricing tactics that cost consumers hundreds annually.
Table of Contents
- What Are Price History Charts And Why They Matter
- Understanding Price History Charts: Interpreting Trends And Spotting Deals
- Popular Price Tracking Tools And Their Features Explained
- How To Apply Price History Charts For Smart Shopping And Maximum Savings
- Save Money Effortlessly With Pricelix
- Frequently Asked Questions
Key takeaways
| Point | Details |
|---|---|
| Price history reveals trends | Charts show fluctuations over weeks or months, exposing patterns snapshots miss. |
| Timing purchases saves significantly | Tracking historical data helps shoppers save $10 to $100+ per item by buying at optimal moments. |
| Tools automate the process | Platforms like Keepa and CamelCamelCamel provide alerts and historical analysis without manual effort. |
| Fake discounts become obvious | Historical data exposes inflated “was” prices and manipulative sales tactics retailers use. |
| Everyone benefits from data | Shoppers make informed decisions while sellers optimize pricing strategies using the same insights. |
What are price history charts and why they matter
A price history chart is a graphical representation showing how a product’s price changed over time, typically displaying weeks or months of data in an easy to read format. These charts plot price points along a timeline, revealing patterns like seasonal drops, sudden spikes, or gradual trends that single price checks cannot capture.
Price tracking tools collect data over time through web scraping and data aggregation, automatically monitoring thousands of products across multiple retailers. This automation solves a critical problem: manual price checks miss opportunities and waste valuable time compared to automated systems that work around the clock.
The charts display several key metrics that inform purchasing decisions:
- Lowest recorded price during the tracking period
- Highest price point and when it occurred
- Average price to establish baseline value
- Frequency and magnitude of price drops
- Duration of sales or promotional periods
Understanding [why tracking price history matters](https://price-lix.com/blog/why tracking price history matters) goes beyond just finding lower prices. These charts help you recognize pricing patterns specific to products or retailers, predict future drops based on historical behavior, and build confidence in your purchase timing.
Pro Tip: Don’t fixate only on the absolute lowest price shown on a chart. Examine how often prices dip to attractive levels and how long those windows last, helping you set realistic expectations and catch deals when they recur.
Understanding price history charts: interpreting trends and spotting deals
Reading price graphs effectively requires understanding three core elements: the timeline showing when prices changed, the price points marking specific values, and the frequency indicating how often fluctuations occur. A jagged chart with frequent changes suggests dynamic pricing algorithms at work, while smoother lines indicate more stable pricing strategies.
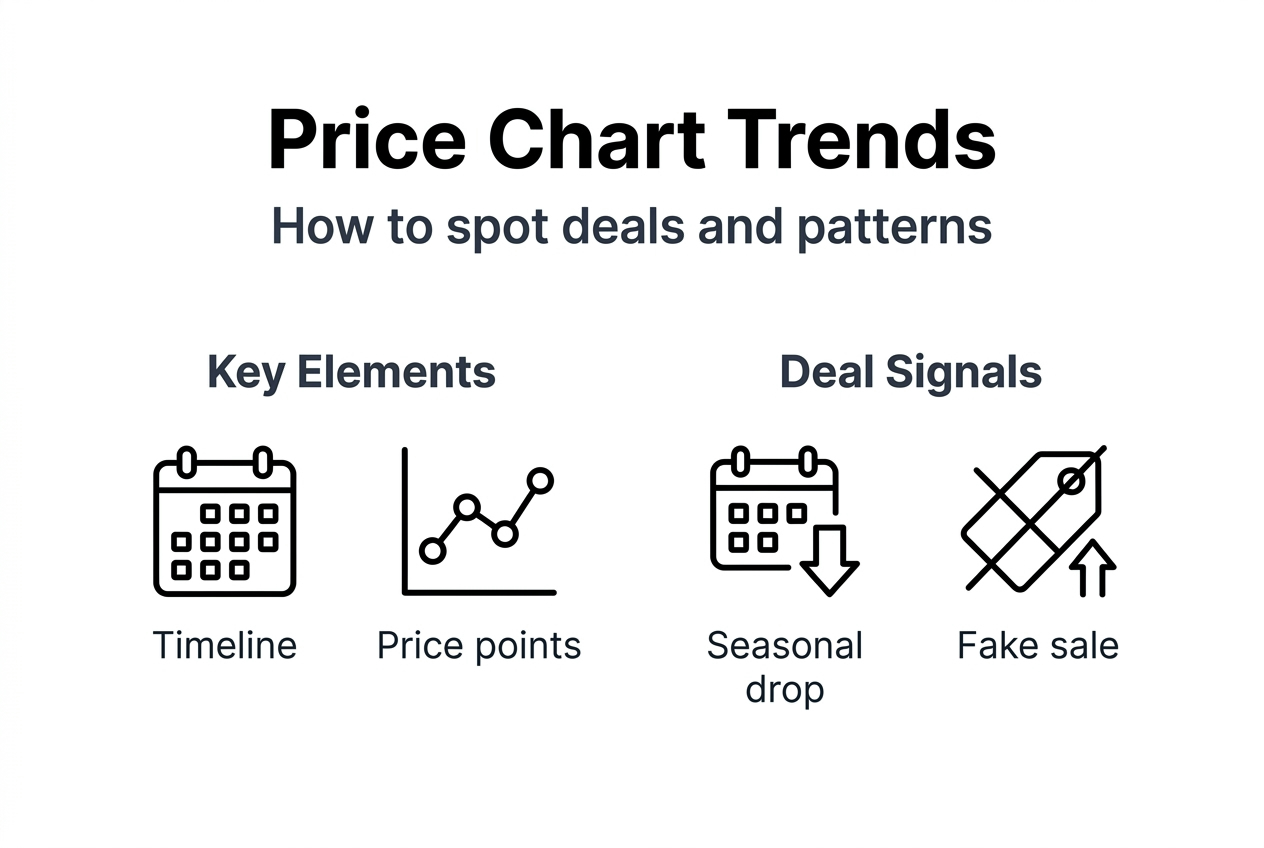
Seasonal price drops follow predictable patterns tied to holidays, product launch cycles, and retail calendars. Electronics often see significant reductions during Black Friday or after new model releases, while home goods drop prices during spring cleaning seasons. Random fluctuations, by contrast, appear as isolated spikes or dips without consistent timing.
![]()
Beware of “was/now” pricing tactics that inflate the original price to make discounts appear larger than reality. Price history charts expose fake discounts by showing whether the “was” price ever actually existed or if it was artificially created for marketing purposes. Research shows up to 30% of products experience pre-sale price hikes designed to create illusory savings during promotional periods.
| Pricing Scenario | Genuine Discount | Fake Sale |
|---|---|---|
| Price 30 days prior | $80 | $65 |
| Advertised “was” price | $80 | $90 |
| Current “sale” price | $60 | $70 |
| Actual savings | $20 (25%) | $5 or less (7%) |
| Chart pattern | Steady then drops | Spike then “discount” |
Understanding why monitor price history helps you spot these deceptive practices immediately. Look for sudden price increases followed quickly by “sales” that bring prices back to normal levels. Real-time price data alerts can notify you when products reach genuine historical lows rather than manufactured discounts.
Pro Tip: Cross-check model numbers and product versions before purchasing. Retailers sometimes discount older models while prominently displaying them alongside current versions, making outdated items appear as deals on new products.
Popular price tracking tools and their features explained
CamelCamelCamel stands as one of the most established free price tracking services, monitoring over 18 million Amazon products internationally with 72 million daily price records. The platform offers a straightforward interface where users can search products, view historical charts, and set price alerts without paying subscription fees. Its browser extension integrates directly into Amazon product pages, displaying price history graphs automatically while you shop.
Keepa provides more comprehensive marketplace coverage and advanced features, supporting additional Amazon regions beyond what CamelCamelCamel offers. With over four million users monitoring nearly six billion products, Keepa delivers both free basic tracking and premium features through a $19 monthly subscription. Premium members access detailed seller statistics, extended historical data, and advanced filtering options.
| Feature | CamelCamelCamel | Keepa |
|---|---|---|
| Price | Free | Free + $19/month premium |
| Amazon marketplaces | Major regions | Extensive global coverage |
| Historical data depth | Years of tracking | Comprehensive with premium |
| Alert options | Email notifications | Email, browser, and mobile |
| Extra features | Basic charts and tracking | Seller stats, inventory tracking, API access |
Both tools provide automated alerts that eliminate manual price checking, sending notifications when products reach your target price or drop below historical averages. This automation helps shoppers capitalize on brief sales windows that might last only hours.
Selecting between tools depends on your shopping habits and needs:
- Casual shoppers tracking occasional purchases benefit from CamelCamelCamel’s free simplicity
- Frequent buyers or resellers gain value from Keepa’s premium analytics and broader data
- International shoppers need Keepa’s expanded marketplace support
- Budget-conscious users start with free versions before upgrading
Understanding the best price tracking strategies 2026 involves matching tool capabilities to your shopping patterns. Learning what is a price alert helps you configure notifications that balance frequency with relevance, avoiding alert fatigue while catching genuine opportunities.
How to apply price history charts for smart shopping and maximum savings
Implementing price tracking into your shopping routine follows a straightforward process that maximizes savings without adding complexity.
- Identify products you plan to purchase within the next three to six months, creating a watchlist of items that aren’t urgent purchases.
- Add each product to your chosen tracking tool, setting price alert thresholds based on historical low prices shown in the charts.
- Review the price history to identify patterns, noting whether prices drop seasonally, after new releases, or during specific promotional periods.
- Configure alert preferences to notify you immediately when prices hit targets, using email or mobile notifications for time-sensitive deals.
- When alerts trigger, verify the deal by checking the chart to confirm the price represents a genuine low compared to historical data.
- Make purchase decisions by comparing current prices against historical averages, not just advertised discounts or “limited time” pressure.
Interpreting alerts requires distinguishing between minor fluctuations and significant opportunities. A drop of $5 on a $200 item may not warrant immediate action, while a $40 reduction to a historical low suggests buying now. Context matters: if charts show prices regularly dipping lower during upcoming holiday sales, waiting makes sense even when current prices look attractive.
Shoppers save $10 to $100+ per item by timing purchases based on historical analysis rather than impulse. Studies indicate consumers consulting price history are 15% more likely to make informed decisions, avoiding regret from overpaying or missing better deals days later.
Seasonal trends provide predictable windows for major savings. Electronics drop significantly during Black Friday and after CES announcements in January. Home improvement items see reductions in late summer and early fall. Clothing follows clearance patterns at season ends. Consulting historical charts reveals these patterns for specific products, letting you plan purchases around optimal timing.
Avoiding impulse buys triggered by artificial urgency requires discipline supported by data. When retailers display countdown timers or “only 3 left” warnings, check the price history. If the current price sits above recent averages or the product frequently goes on sale, the urgency is manufactured. Your tracking data provides objective evidence against emotional manipulation.
Pro Tip: Integrate price alerts with your personal budget and shopping calendar for maximum effectiveness. Set alerts three to four weeks before you actually need items, giving yourself time to catch deals without pressure, and align purchases with paydays or when you’ve allocated specific funds.
The price tracking checklist 2026 provides a comprehensive framework for implementing these strategies systematically, turning occasional price checks into consistent savings habits that compound over time.
Save money effortlessly with PriceLix
While individual tracking tools serve specific marketplaces well, managing price alerts across multiple retailers and hundreds of products becomes overwhelming quickly. PriceLix solves this complexity by consolidating price tracking for Amazon, eBay, Walmart, and over a thousand stores into one intuitive dashboard.
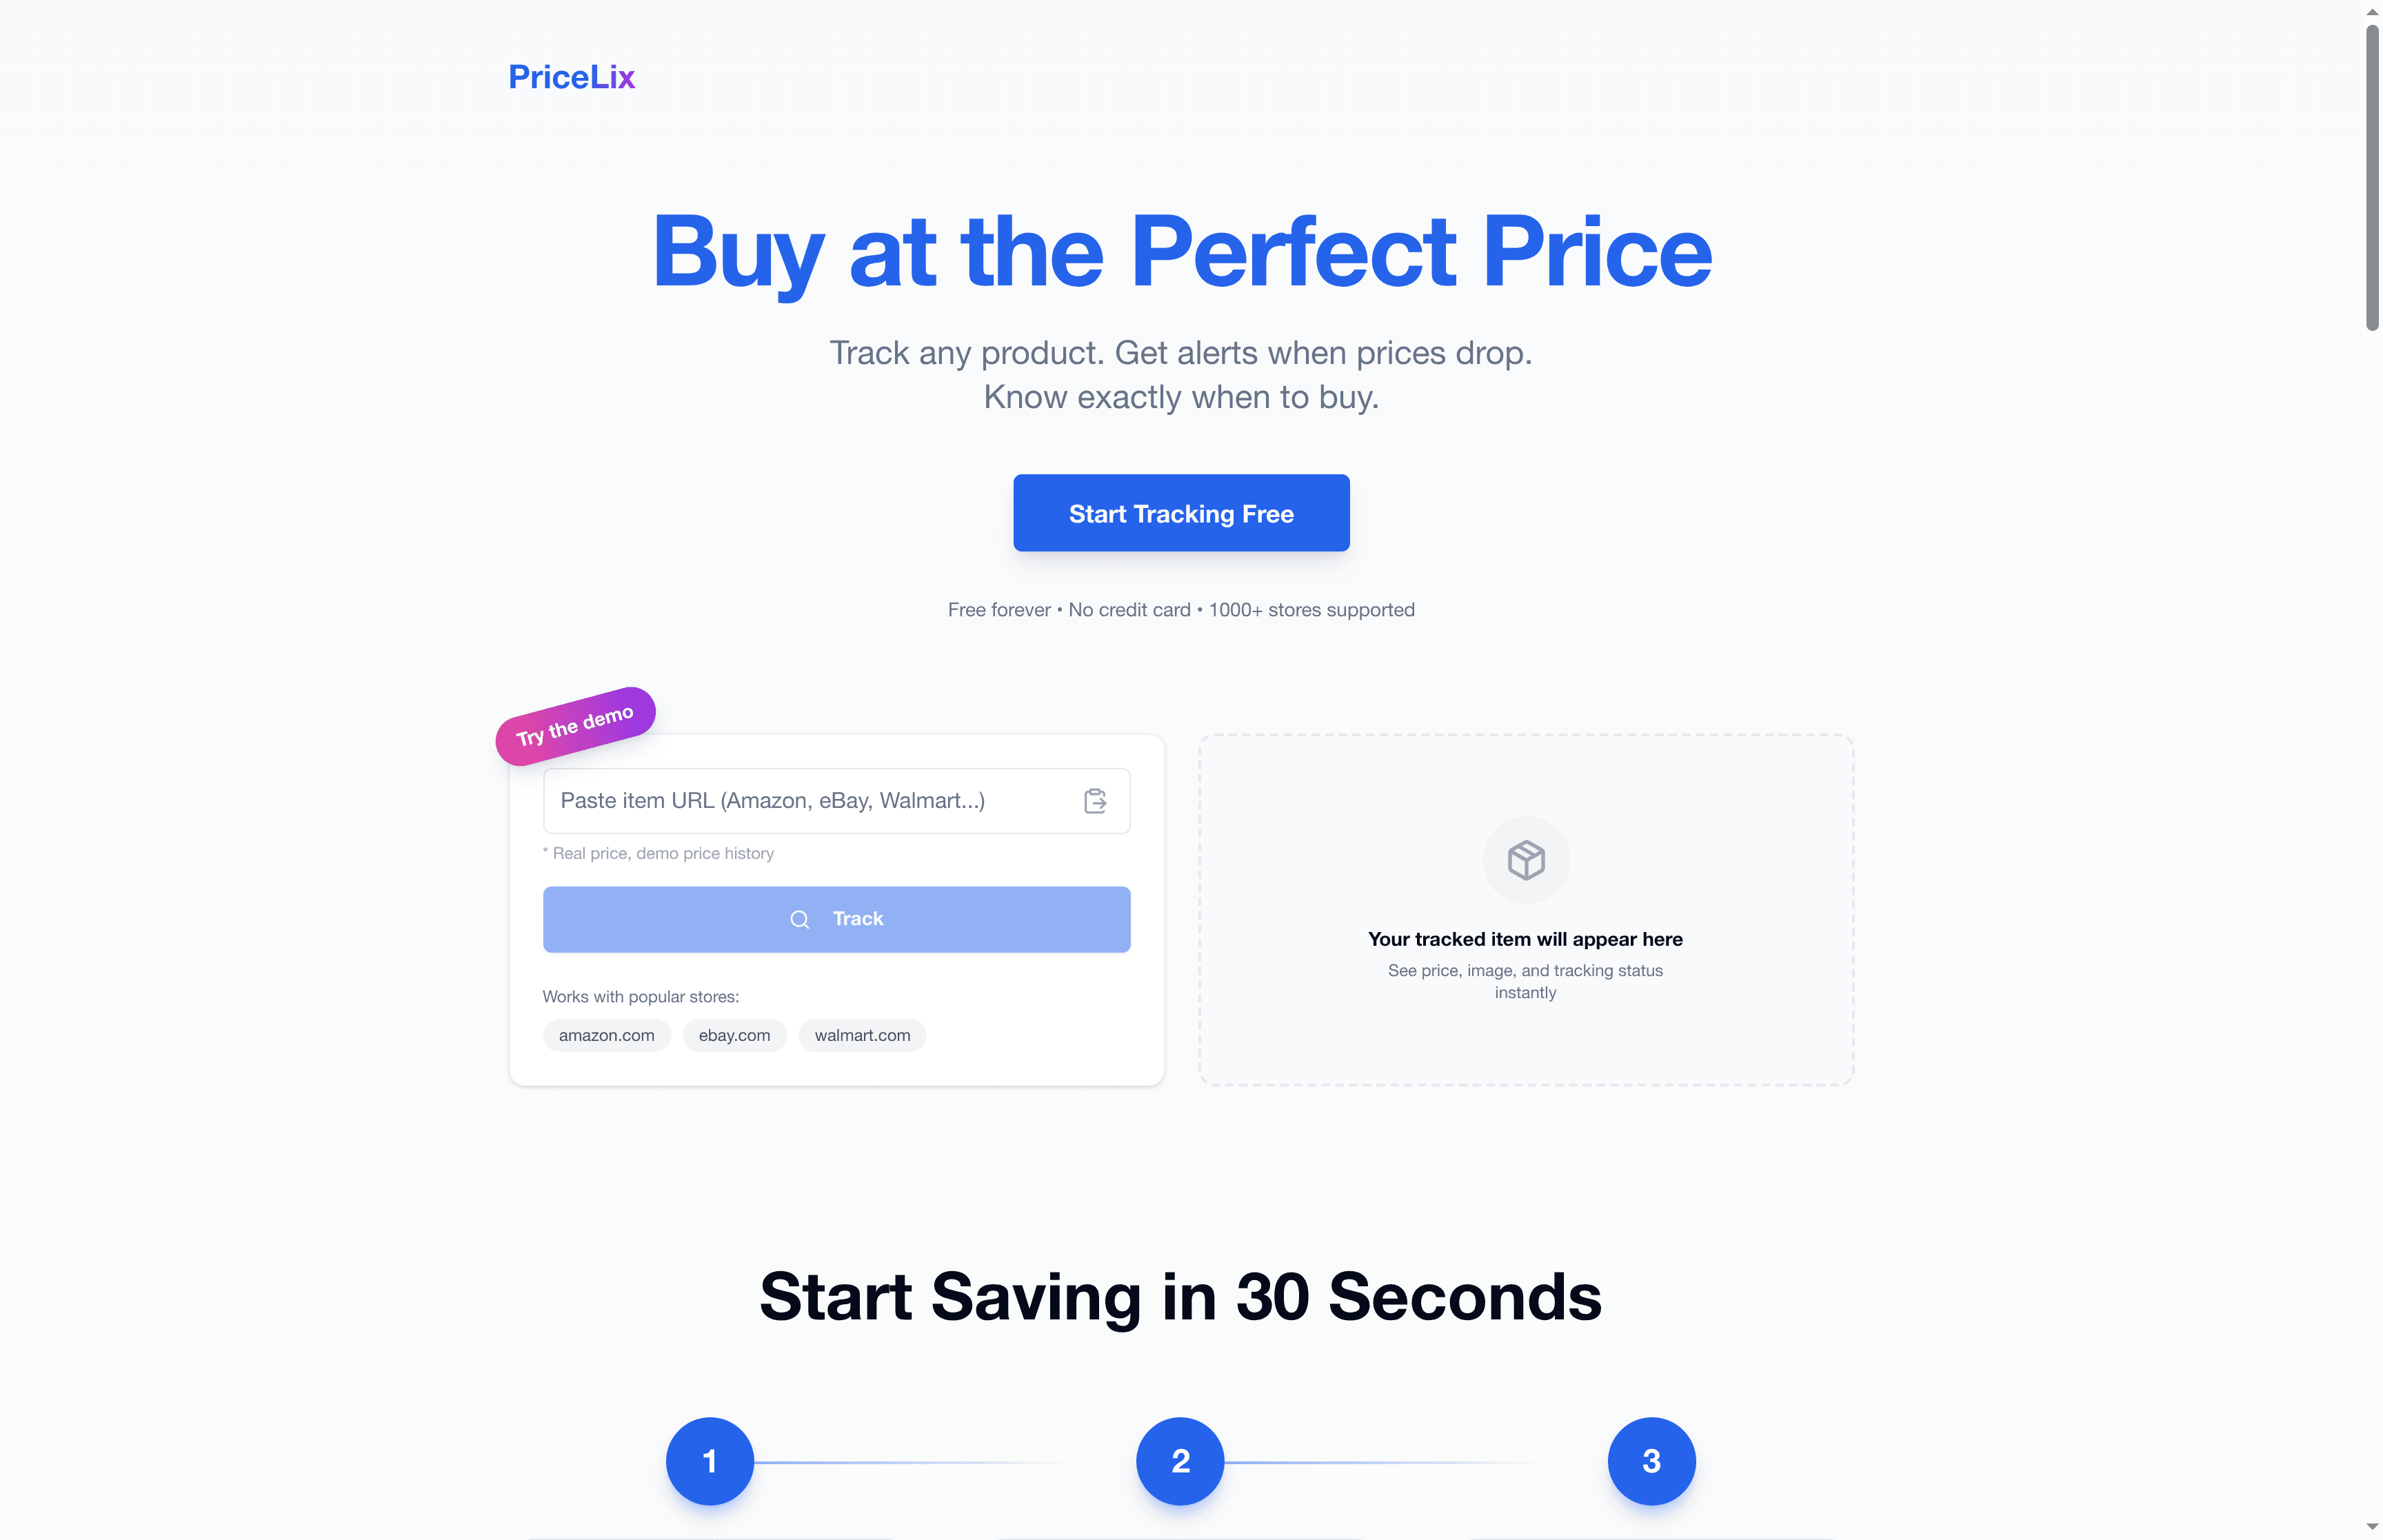
The platform automates daily price checks and sends real-time alerts when products hit your target prices, eliminating manual monitoring across different sites and browser extensions. Your personalized dashboard organizes tracked items by priority, showing which products are at historical lows and which are trending toward better deals.
PriceLix makes strategic shopping accessible without technical expertise or time investment. Start tracking your favorite products today and let automated alerts ensure you never overpay or miss genuine discounts again.
Frequently asked questions
What is a price history chart?
A price history chart is a visual graph showing how a product’s price changed over days, weeks, or months across online retailers. The chart plots price points on a timeline, revealing patterns like seasonal drops, gradual increases, or sudden promotional discounts that help shoppers identify optimal buying moments.
How accurate are price tracking tools?
Price tracking tools achieve high accuracy by scraping retailer websites multiple times daily, capturing real-time price changes as they occur. While occasional delays of a few hours may happen during high-traffic periods, established platforms like Keepa and CamelCamelCamel maintain reliability through redundant data collection systems that verify prices across multiple checks.
Can price history predict future discounts?
Price history cannot guarantee future discounts but reveals patterns that strongly suggest when sales will recur. Products with consistent annual drops during Black Friday or post-holiday clearances likely follow similar patterns in subsequent years, though exact timing and discount percentages may vary based on inventory levels and competitive pressures.
Do all retailers allow price tracking?
Most major online retailers permit price tracking since tools simply observe publicly available data without accessing restricted systems. However, some sites attempt to block automated scraping through technical measures, though established tracking services adapt quickly to maintain functionality across supported marketplaces.
How far back should I check price history?
Check at least three to six months of price history for most products to identify seasonal patterns and typical price ranges. Electronics and items with annual release cycles benefit from reviewing 12 months of data, capturing full seasonal cycles and product refresh impacts on pricing.
Are free price tracking tools sufficient?
Free tools like CamelCamelCamel provide excellent functionality for casual shoppers tracking occasional purchases on Amazon. Frequent buyers, resellers, or those shopping across multiple international marketplaces gain significant value from premium services offering advanced analytics, broader coverage, and priority alerts that justify subscription costs through increased savings.