
How to predict the best time to buy online
TL;DR:
- Timing your purchases based on seasonal patterns and price history allows you to buy items at their true lowest prices rather than during fleeting sales. Retailers often offer deeper discounts during inventory clearance periods, which can be identified through careful tracking and analysis, rather than relying solely on advertised sales events. Using tools like price history charts and setting automated alerts helps consumers make data-driven decisions, ultimately maximizing savings and avoiding overpaying.
You hit “buy now” during a big sale, feeling like a genius. Then, two weeks later, the same item drops another $40. Sound familiar? Most shoppers think the secret to saving money is simply waiting for the next sale event. But that strategy alone leaves serious money on the table. The real edge comes from combining seasonal patterns, individual product price history, and smart timing signals. In this guide, we break down exactly how to do that so you can stop guessing and start buying at the right time, every time.
Table of Contents
- Why timing your purchase matters more than you think
- Seasonal and promotional cycles: When are the lowest prices?
- The power of price history: Don’t let “sales” fool you
- Advanced methods: How machine learning and timing signals predict deals
- A practical system: Step-by-step guide to predicting your next best buy moment
- Perspective: Why most shoppers still overpay (and how to flip the script)
- Start saving smarter with PriceLix
- Frequently asked questions
Key Takeaways
| Point | Details |
|---|---|
| Sales aren’t always lowest | Track product price history to uncover real deals, not just advertised sales. |
| Follow seasonal cycles | Major promo events bring deep discounts, but cycles vary by product type. |
| Use decision thresholds | Set buy or wait points based on historic lows to maximize savings and avoid FOMO. |
| Tech enhances timing | Leverage price alerts and history tools for consistent, data-driven purchase decisions. |
Why timing your purchase matters more than you think
Let me hit you with some reality first. A popular 65-inch TV can swing by $200 or more throughout the year. A laptop you want for back-to-school might peak in August and drop quietly in October. These aren’t rare exceptions. Price fluctuations of this size happen constantly across nearly every product category.
The common belief is that sales events equal the lowest prices. That’s not always true. Retailers know you’re watching during Black Friday and Cyber Monday. Sometimes they inflate the “original” price before cutting it, making a modest discount look huge. Other times, the real price floor happens weeks before or after the event itself, when inventory pressure forces a genuine markdown.
Seasonal inventory cycles and major promo events drive the deepest discounts, but those windows are short-lived. A month-by-month buying guide confirms that retailers’ deepest discount timing is typically driven by the need to clear inventory before a new season or product cycle kicks in. That changes the game entirely. You’re not just looking for “a sale.” You’re looking for the specific window when a retailer has the most pressure to move that item.
“Waiting for the next big sale doesn’t guarantee the lowest price. Sometimes, post-event prices drop even further as retailers clear leftover stock.”
Quick wins to keep in mind:
- Identify traditional sales periods for your product category
- Don’t rely solely on advertised “sale” events
- Watch for post-sale inventory clearance drops
- Know that each product type follows its own pricing rhythm
Pro Tip: Start tracking a product’s price at least 30 to 60 days before a known sale event. That baseline gives you a real reference point so you can spot an actual bargain instead of a manufactured one.
Seasonal and promotional cycles: When are the lowest prices?
Not all products go on sale at the same time. That’s a critical point most shoppers miss. Understanding the unique seasonal cycle for your specific product type gives you a real negotiation edge.
![]()
The fashion seasonality deals calendar is completely different from the electronics calendar, which is different again from the appliance calendar. Buying a winter coat in February feels late, but that’s actually when clearance pricing hits its lowest point. Buying a refrigerator in May around Memorial Day weekend lands you in one of the deepest discount windows of the year.
A helpful month-by-month guide maps this out clearly: Presidents’ Day weekend is prime time for mattresses and TVs, Memorial Day is the sweet spot for refrigerators and cooking appliances, Labor Day marks excellent timing for computers, and Black Friday remains king for electronics across the board.
Here’s a quick reference table to make this concrete:
| Product category | Best purchase window | Key sale event |
|---|---|---|
| TVs and monitors | January, Black Friday | Super Bowl season, Cyber Monday |
| Laptops and computers | August, Labor Day | Back-to-school, Labor Day sales |
| Refrigerators and appliances | May | Memorial Day weekend |
| Mattresses | February, May | Presidents’ Day, Memorial Day |
| Winter clothing | January to February | Post-holiday clearance |
| Summer clothing | August to September | End-of-season clearance |
| Furniture | January, July | New Year clearance, mid-year sales |
“Knowing which month targets your product type can save you hundreds without waiting indefinitely.”
You can also apply seasonal discount strategies throughout the year to layer multiple savings opportunities. And with a solid seasonal sale tracking approach, you build a pattern recognition habit that becomes almost automatic.
Here’s a numbered approach to apply seasonal cycles to your own shopping:
- Identify the product category and look up its historically best purchase window
- Mark the upcoming sale events on your calendar that align with that window
- Start price tracking 4 to 6 weeks before the event so you have a baseline
- Check inventory levels closer to the event, since stock pressure often drives the deepest cuts
- Look at post-sale pricing in case leftover inventory triggers a further markdown
Also worth exploring are designer sale guides if you’re shopping for premium or luxury items, since those categories follow completely distinct markdown timelines.
The power of price history: Don’t let “sales” fool you
Here’s where it gets real. An official sale badge doesn’t mean you’re looking at the lowest price that product has ever been. Retailers are sophisticated. They understand consumer psychology, and they use it. A “30% off” sticker is meaningless unless you know what the actual price floor looks like.
That’s exactly why price history charts are so powerful. They show you the baseline price, the spikes (often around demand peaks), and the genuine dip patterns. When this chart becomes gold is when you overlay a current “sale” price against 12 months of history and realize the item was actually cheaper three months ago.
Using product-level historical price charts to check whether the current offer is near a historical low is a fundamental step no savvy shopper should skip. Here’s what a real price trend might look like for a popular coffee maker:
| Time period | Price |
|---|---|
| January (baseline) | $89 |
| March (pre-spring spike) | $99 |
| May (Memorial Day “sale”) | $79 |
| July (summer baseline) | $84 |
| October (pre-holiday build) | $94 |
| November (Black Friday) | $69 |
| December post-holiday | $72 |
In this example, Black Friday actually delivers the genuine low. But look at how the price jumped artificially in October before the “big sale.” That context matters enormously.
Questions to ask when reviewing a price history chart:
- What is the true baseline price for this item over the last 6 to 12 months?
- How often does it dip below that baseline, and for how long?
- Is the current “sale” price actually below the historical average or just below a recent spike?
- Has the item recently been repriced upward to make a discount look larger?
- What does the trend look like: is it generally falling, rising, or flat?
Pairing best price tracking strategies with an understanding of the role of price history gives you a complete picture. You stop reacting to sale labels and start responding to actual data.
Pro Tip: Set a personal threshold. For example, “I will buy this item when it hits $X, which is within 5% of its historical low.” That threshold keeps emotion out of the decision and prevents you from impulse buying at inflated “sale” prices.
Advanced methods: How machine learning and timing signals predict deals
Retailers aren’t just guessing when to drop prices. They’re running sophisticated algorithms that factor in dozens of signals at once. Understanding how that works helps you anticipate their moves rather than react to them.
E-commerce predictive analytics methods commonly combine time-series modeling with signals like user engagement patterns, cart behavior, price change history, and holidays. Essentially, a retailer’s system learns that if a certain product has been sitting in thousands of carts without converting, it’s time to trigger a discount. They’re also timing promotions to coincide with high engagement windows.
Here’s what that means for you. These systems create predictable discount patterns that you can learn to recognize:
- High cart abandonment rates on a product often precede a price drop within days
- Post-holiday inventory surges force clearance pricing to move unsold stock quickly
- New model launches almost always drop the price of the previous generation
- End-of-quarter periods sometimes trigger retailer promotions to hit revenue targets
- Low engagement days like mid-week can produce algorithm-driven pricing experiments
Shopping-time studies show that prices between 6 a.m. and noon tend to run lower, and Tuesday mornings rank among the cheapest windows for online purchases. But here’s the nuance: timing alone isn’t a magic bullet. These patterns shift constantly as retailers adapt their algorithms.
“Timing signals like day of week and time of day are useful directional clues, but they should always be layered over price history data, not used as a standalone strategy.”
Understanding price trends at the product level keeps you grounded. The algorithmic patterns give you an edge in timing, but the price history gives you the confidence to pull the trigger at the right moment.
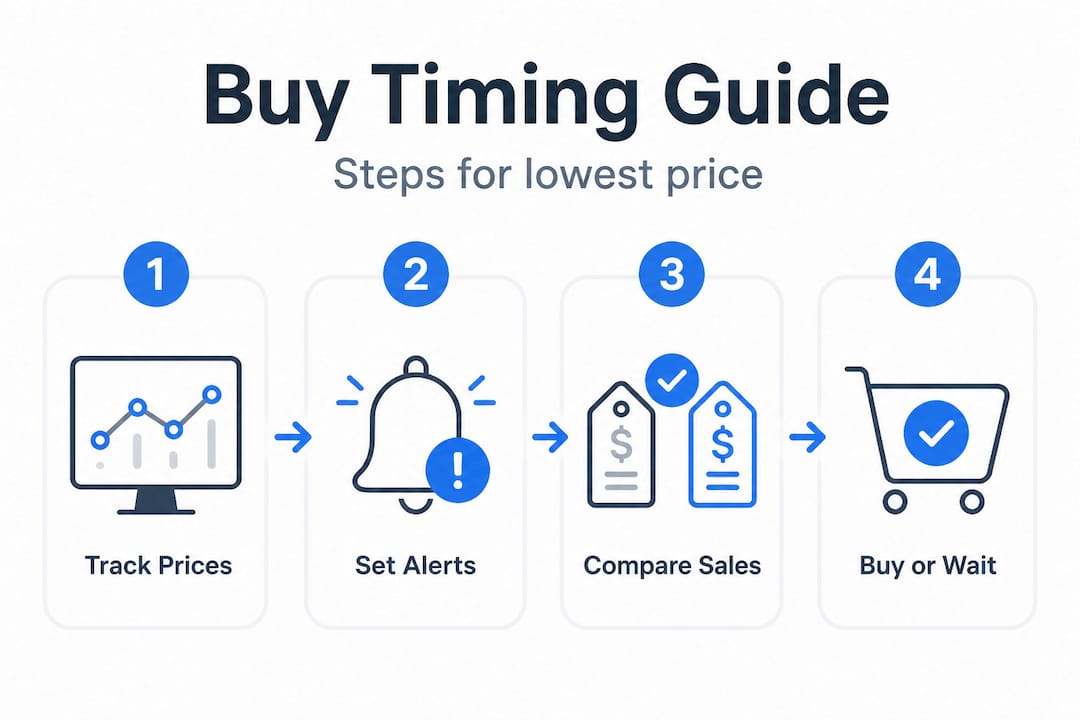
A practical system: Step-by-step guide to predicting your next best buy moment
Knowing all of this is great. Applying it consistently is what separates shoppers who save money from those who stay frustrated. Here’s a repeatable system you can use every single time.
A robust “best buy time” strategy involves three core layers: identify the product category’s seasonal and promo windows, use price history charts to verify whether the current offer is near a historical low, and set buy or wait thresholds to avoid inflated “sale” prices.
Here’s the full step-by-step checklist:
- Identify your product’s seasonal window using a category reference guide or past data
- Start tracking the price immediately, even if your target event is weeks away
- Pull the price history and identify the genuine baseline and historical low
- Set a buy threshold based on the historical low, not the advertised original price
- Watch for timing signals like day of week, new model releases, or inventory events
- Set a price alert so you’re notified the moment your threshold is hit
- Be willing to walk away if the threshold isn’t met. Patience is part of the strategy.
Here’s a quick reference summary:
| Step | Action | Tool or method |
|---|---|---|
| Research | Find seasonal window for your category | Category buying calendars |
| Baseline | Pull 6 to 12 months of price history | Price tracking platforms |
| Threshold | Set a realistic buy price | Historical low minus 5 to 10% |
| Monitor | Activate price alerts | Automated tracking tools |
| Execute | Buy when threshold is hit | Act fast once alert fires |
| Reassess | Check post-sale prices if you missed | Continue monitoring |
Using historical price data turns this from guesswork into a genuine system.
Pro Tip: Use price alerts and commit to walking away if the alert never fires. Sometimes the best buying decision is deciding not to buy. That discipline alone will save you more money than any sale event.
Perspective: Why most shoppers still overpay (and how to flip the script)
Here’s the uncomfortable truth. Most people know they should shop smarter. They just don’t because the urgency retailers create feels real and immediate. “Only 3 left!” “Price valid today only!” These messages are designed to override your analytical brain and trigger your emotional one.
Advanced shoppers treat those messages as noise. They’ve seen enough price history charts to know that “limited time” offers often reappear within days. The house always wins if you let urgency replace evidence.
The real shift is moving from impulse to process. When you have a threshold and a price alert set, the decision is already made. You’re not debating whether to buy while staring at a countdown timer. You’re simply waiting for your pre-defined signal. That’s a completely different psychological position and a far more powerful one.
There’s also a discipline most shoppers undervalue: walking away. It feels like losing. But if a product never hits your threshold, it probably wasn’t a genuine deal to begin with. Using advanced tracking strategies builds the habit of replacing hope with data, and that habit compounds over time.
I genuinely believe anyone can develop this kind of disciplined timing intuition. It’s not about being a spreadsheet obsessive or a tech expert. It’s about having the right tools in place so the process does the work for you.
Start saving smarter with PriceLix
You’ve just learned a genuine framework for buying online at the lowest possible price. The seasonal windows, the price history checks, the timing signals, and the threshold strategy. Now the question is: who does the monitoring for you?
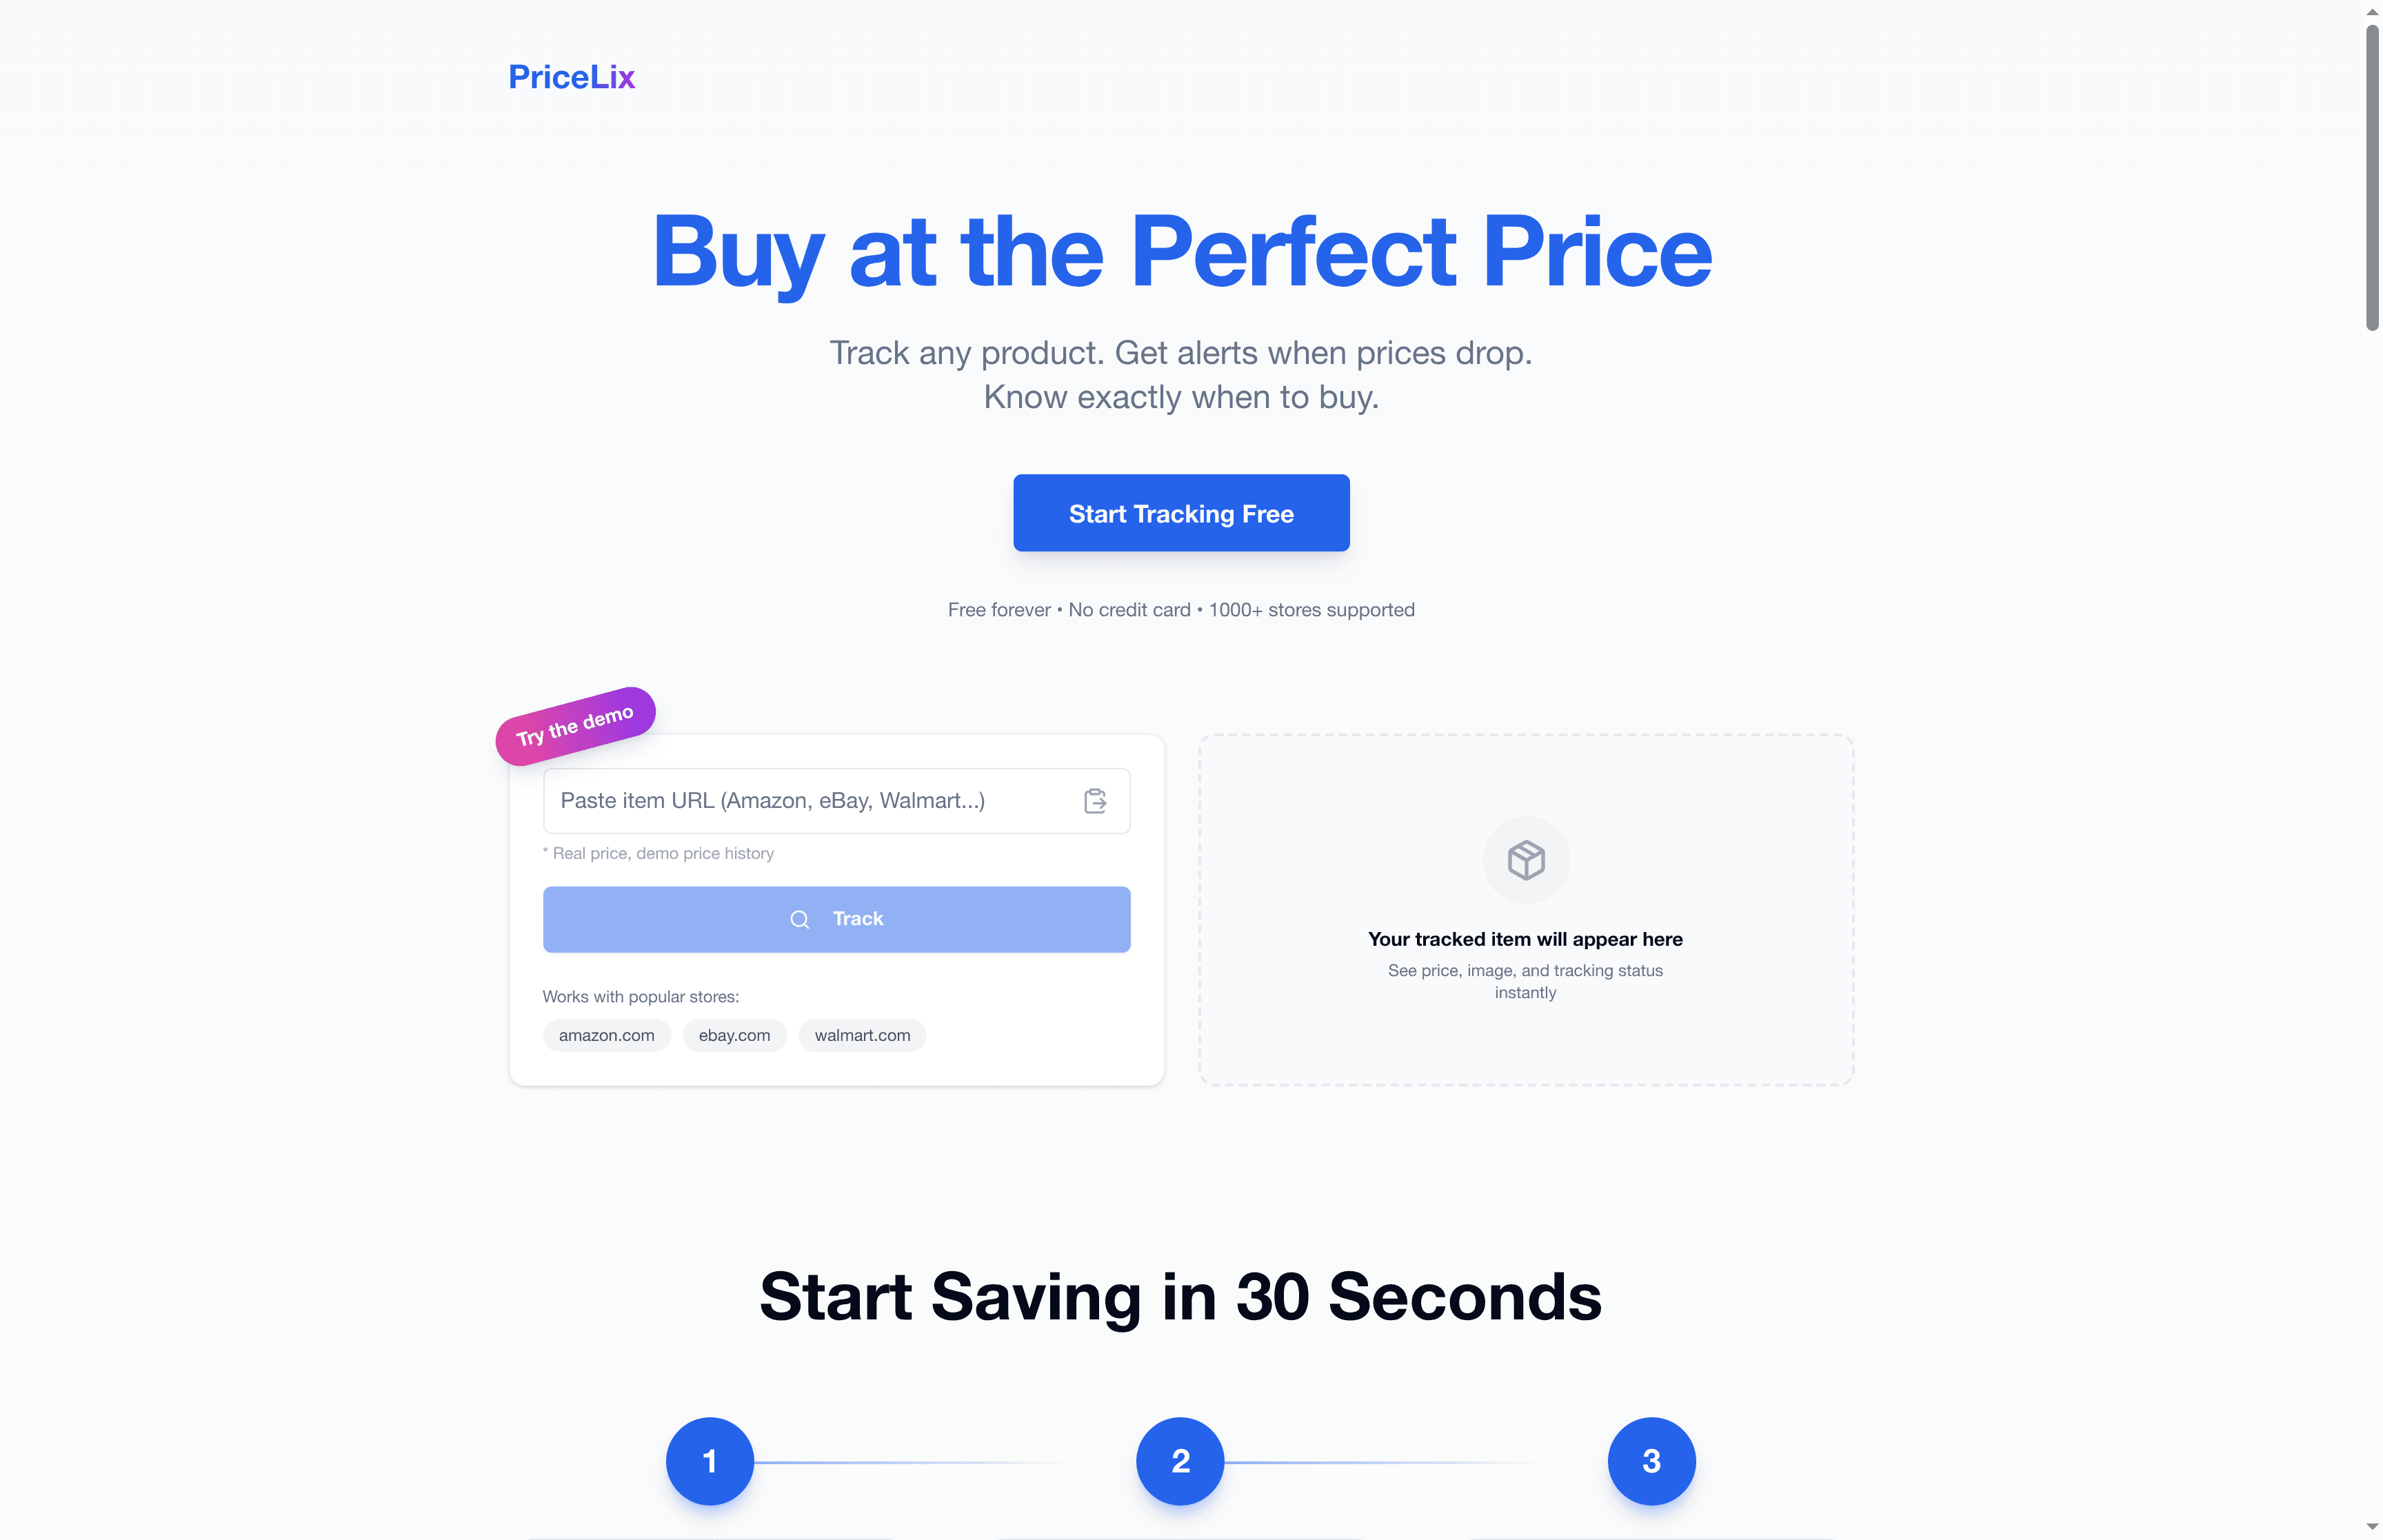
PriceLix is built exactly for this. It tracks prices automatically across Amazon, eBay, Walmart, and over a thousand other stores. You get real-time alerts when a product hits your target price, plus detailed price history charts so you can verify whether a deal is real. No browser extensions needed. No manual checking. Just a clean dashboard that does the work while you focus on other things. If you’re serious about applying what you’ve learned here, PriceLix is the tool that makes it effortless.
Frequently asked questions
Is it always better to wait for big sale events like Black Friday?
Sale events can offer steep discounts, but price trend tools often reveal that individual products hit their lowest points at other times of year, making price history checks essential before any major purchase.
What tools help track if a deal is really the lowest price?
Price history charts are your best resource, since product-level historical data shows whether the current price is genuinely near its all-time low or just below a recent artificial spike.
Are day of week or time of day really important for getting deals?
Shopping-time studies show Tuesday mornings and early hours tend to offer slightly lower prices, but these patterns are most useful when combined with price history rather than used on their own.
How do e-commerce sites predict when to discount items?
Retailers use machine learning systems that combine time-series modeling with signals including cart behavior, user engagement, holidays, and price change history to decide when and how deeply to discount.
Recommended
- 6 Best Price Tracking Strategies 2026 for Online Shoppers | PriceLix
- Price Drops Meaning – Why Timing Matters Most | PriceLix
- Price comparison best practices for online shopping 2026 | PriceLix
- 6 Must-Know Price Drop Strategies for Smart Online Shoppers | PriceLix
- 10 Tipps, wie du am Black Friday 2025 die besten Fashion-Schnäppchen m – Breuermode.de