
Why historical price data transforms how you shop
TL;DR:
- Most shoppers buy without checking if sale prices are the lowest historically available.
- Historical price data reveals true lows, seasonal trends, and retailer differences for smarter shopping.
- Using multiple price tracking tools and alerts helps avoid overpaying amidst dynamic and personalized pricing.
Online prices change constantly, and most shoppers don’t notice until after they’ve already paid too much. One day a laptop is $799, the next it’s $649, and two weeks later it’s back up to $849. If you don’t know that history, every sale looks like a real deal. Here’s the uncomfortable truth: 70% of US online shoppers say competitive pricing is their top priority, yet most of them buy without ever checking whether the “sale” price is actually the lowest that product has ever been. That’s money left on the table, every single time.
Table of Contents
- What is historical price data and why does it matter?
- How price history reveals patterns and influences your buy decisions
- Evaluating price tracking tools: What most shoppers miss
- Navigating dynamic and personalized pricing: Transparency and protection
- Why most shoppers underutilize historical price data and how to change it
- Take your shopping strategy to the next level with PriceLix
- Frequently asked questions
Key Takeaways
| Point | Details |
|---|---|
| Trends Matter Most | Recognizing price patterns helps you time purchases for maximum savings. |
| Tool Limitations | No price tracking tool is perfect—look out for gaps with flash deals and coupons. |
| Transparency Is Power | Understanding pricing transparency protects you from dynamic or personalized price hikes. |
| Cross-Retailer Comparison | Comparing historical prices across stores uncovers true deals and avoids costly loyalty mistakes. |
What is historical price data and why does it matter?
Historical price data is exactly what it sounds like: a record of what a product has cost over time. Think of it as a price diary. Every time a retailer adjusts the price on an item, that change gets logged. Over days, weeks, and months, that log turns into a chart that tells you the full story of how that product is priced.
Why does that story matter? Because retailers know something most shoppers don’t: prices are not random. They follow patterns tied to inventory levels, competitor moves, seasonal demand, and promotional cycles. Without historical data, you’re shopping blind. With it, you can see whether today’s “40% off” claim is genuine or just the baseline price with a fake markdown slapped on top.
Here’s what historical price data actually reveals:
- The true lowest price a product has ever hit, not just its current “sale” price
- Seasonal patterns, like electronics dropping every November or outdoor gear going cheap in early spring
- Artificial price inflation, where retailers raise the “original” price before running a sale so the discount looks bigger
- Long-term price trends, showing whether a product is generally getting cheaper or more expensive over time
- Cross-retailer differences, proving that the same product might be $30 cheaper at Walmart than at Amazon on any given day
That last point is huge. Tools that track billions of products across multiple retailers show shoppers consistently save more by comparing stores rather than staying loyal to a single platform. The idea that Amazon is always cheapest is a myth, and price history charts expose that myth fast.
“A sale isn’t a sale unless the price is actually lower than it’s been before. Historical price data is the only way to know for sure.”
When you start using online price comparison tools that include price history charts, budgeting gets sharper too. You stop impulse buying based on artificial urgency and start making planned purchases at predictable low points. That’s not just smart shopping. That’s financial discipline with data behind it.
Pro Tip: Before buying any item over $50, pull up its price history chart first. If the current price is near the all-time low, it’s probably a good time to buy. If it’s near the all-time high with a “sale” tag on it, walk away.
Understanding how to compare prices effectively across retailers, and doing it with historical context rather than just today’s snapshot, is the single biggest upgrade you can make to your shopping strategy.
How price history reveals patterns and influences your buy decisions
Knowing what historical price data is and seeing it in action are two very different things. Let’s get practical. When you look at a price history chart, you’re not just seeing random ups and downs. You’re seeing signals. And those signals should directly change what you do next.
![]()
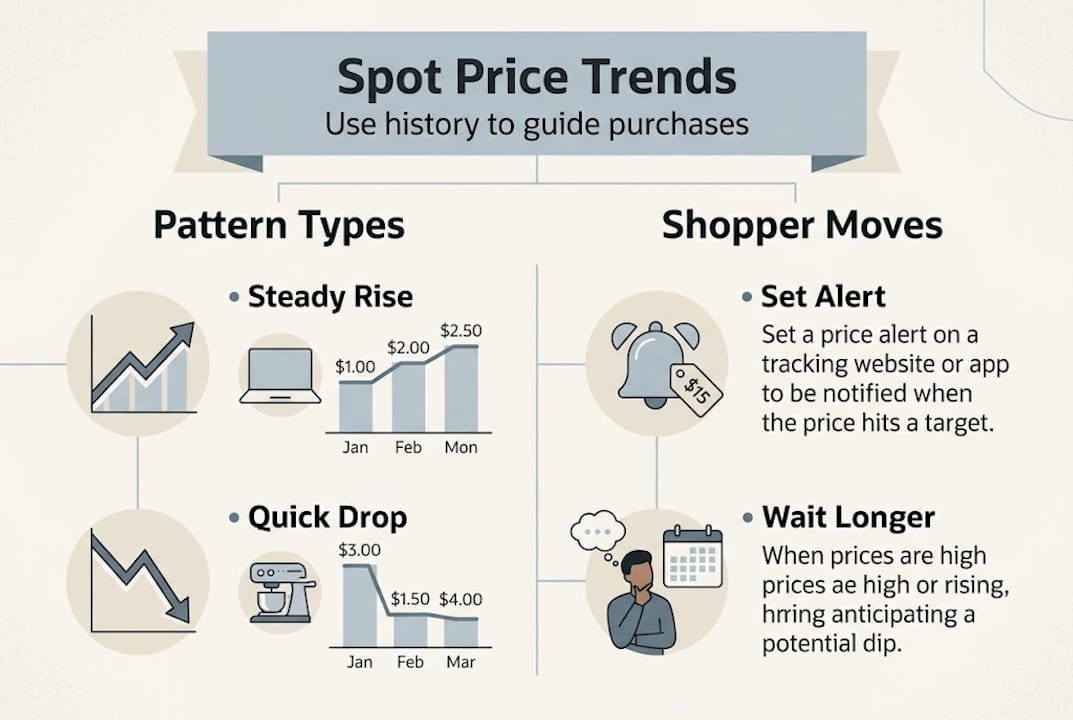
Research shows that consumers predict price streaks to continue after three or more consecutive changes in one direction, meaning if a price has dropped steadily over the past four weeks, shoppers reasonably expect it to keep dropping and choose to wait. But when there’s a single large, sudden price drop after a period of stability, shoppers correctly interpret that as a potential reversal and move to buy immediately. This is not just instinct. It’s pattern recognition backed by data.
Here’s how to apply this in practice:
- Look at the 90-day chart first. A 30-day view can be misleading. Zoom out to 90 days and you get a much clearer picture of whether a dip is part of a longer trend or a genuine anomaly.
- Identify the pattern type. Is the price gradually declining? Stable with occasional spikes? Bouncing between two price points? Each pattern calls for a different response.
- Check if the current price breaks the pattern. A sudden drop well below the typical range is a strong buy signal. A price sitting right at the average means there’s no urgency.
- Compare across categories. Electronics tend to drop after new model releases. Toys spike before holidays and crash in January. Knowing your category’s rhythm helps you time purchases with confidence.
| Price pattern | What it signals | Best action |
|---|---|---|
| Gradual decline over 3+ weeks | More drops may be coming | Wait and monitor |
| Sudden single large drop | Likely a temporary deal | Buy now |
| Stable with seasonal spikes | Known cycle, predictable | Plan ahead and buy at the low point |
| Volatile, no clear pattern | Unpredictable pricing | Set an alert at your target price |
Understanding dynamic pricing explained in the context of these patterns is essential. Retailers use algorithms that adjust prices hundreds of times a day based on demand, competition, and inventory. Without a price history chart, you’d never know whether you caught a deal or got caught by the algorithm.
Pro Tip: Use price alerts set at or near the all-time low, not just any drop. A 5% discount from a price that was already inflated is not a deal. An all-time low is. Understanding online pricing tactics helps you spot the difference immediately.
Evaluating price tracking tools: What most shoppers miss
There are several solid price tracking tools out there. CamelCamelCamel is popular for Amazon. Keepa goes deeper with detailed charts and retailer comparisons. Honey and Capital One Shopping offer browser-based coupon and price alerts. Each has strengths, but each has blind spots too.
Here’s what most shoppers miss when evaluating these tools:
- Lightning deals and flash sales are often invisible. Most tracking tools only log the standard listed price. Amazon Lightning Deals, for example, may not appear in the historical data at all, meaning you could see a “lowest ever” price that’s actually higher than a flash deal from last week.
- On-page coupons don’t register. If Amazon displays a $20 off coupon directly on the product listing but doesn’t reduce the listed price, the tracking tool logs the full price. You’d never know the coupon existed just by looking at the chart.
- Single-retailer tools create a dangerous blind spot. If you only track Amazon prices, you have no idea that Walmart has been selling the same item $40 cheaper for the past six months.
| Tool | Strengths | Limitations |
|---|---|---|
| CamelCamelCamel | Long Amazon price history, free | Amazon only, misses coupons |
| Keepa | Deep data, browser extension | Subscription for full features |
| Honey | Easy to use, finds coupons | Limited history, browser dependent |
| PriceLix | Multi-retailer tracking, alerts | Newer platform, growing coverage |
Dynamic pricing protections are an emerging concern because retailers using personalized pricing can actually show different prices to different shoppers based on browsing history, location, or device. Standard tracking tools can’t account for this variation because they track one version of the listed price, not the price you specifically see.
That’s why experts consistently recommend using multiple tools together. Check the historical chart on one platform, verify the current price on another, and always scan at least two or three competing retailers before clicking buy.
The top price comparison apps that offer multi-retailer tracking give you a more complete picture. No single tool captures everything, but combining a strong history tracker with a cross-retailer comparison platform closes most of the gaps. Following solid price comparison best practices means never relying on one source of information alone.
Pro Tip: Always open a product in a private or incognito browser window before finalizing any purchase. Some retailers use your browsing history to adjust the price you see. A fresh session can sometimes show you a lower rate.
Navigating dynamic and personalized pricing: Transparency and protection
Let’s talk about the tactics retailers use that most shoppers never fully realize are happening. Dynamic pricing means a product’s price changes automatically based on factors like time of day, competitor prices, demand, and inventory levels. Personalized pricing takes it further: the price you see may be different from the price your neighbor sees, based on your individual profile, location, or purchase history.
Here are the key differences:
- Dynamic pricing is market-driven. It responds to supply and demand signals and changes for everyone simultaneously. Think airline tickets or hotel rooms.
- Personalized pricing is shopper-driven. It uses your data to figure out how much you’re likely willing to pay, and charges accordingly. It’s legal, but it raises real fairness concerns.
“When pricing becomes personal, the burden falls on the shopper to stay informed. Transparency is no longer a courtesy. It’s a necessity.”
Let me hit you with some numbers. Dynamic pricing boosts retailer revenue by 12.3% on average, but it also raises cart abandonment rates by 8.7% when shoppers sense they’re being manipulated. That’s a telling tradeoff. Retailers gain on average, but trust takes a hit, and savvy shoppers push back by abandoning carts or going elsewhere.
Lack of pricing transparency creates real risks for shoppers because when you don’t know why a price changed or whether it will change again, you can’t make an informed decision. You’re just guessing.
Here’s how to protect yourself from dynamic and personalized pricing:
- Use incognito mode when shopping to reduce the chance of personalized prices being served to you
- Clear your cookies regularly, especially before large purchases
- Compare prices across devices (phone vs. desktop vs. tablet) to spot discrepancies
- Check price transparency resources to understand how retailers justify their pricing changes
- Track factors affecting online prices so you know when to expect spikes and when prices tend to settle
- Set up real-time price change alerts so you’re notified the moment a price hits your target
The bottom line: dynamic pricing isn’t going away. It’s only getting more sophisticated. Your best defense is staying informed, using multiple tools, and never assuming the price you see today is the price you’ll see tomorrow.
Why most shoppers underutilize historical price data and how to change it
Here’s the part that most articles skip over. People who discover price tracking often make one common mistake: they look at the chart, see that the price is lower than it was last month, and decide to buy. That’s reactive shopping, and it still leaves money on the table.
Real leverage comes from understanding how price comparison works at a deeper level, combining historical data with category-specific knowledge. Electronics behave differently from kitchenware. Seasonal goods follow different rhythms than evergreen products. A price drop in electronics the week before a new model launches is not a deal. It’s a clearance. Those are very different buying situations.
My take: Most shoppers treat price history as a single data point instead of a pattern to decode. The shoppers who actually save the most money don’t just check the chart once. They set targeted alerts near all-time lows, they understand their product category’s natural pricing cycle, and they cross-reference multiple retailers before committing. It takes an extra two minutes and saves you real money. That’s not a complex strategy. It’s just a more complete use of the tools already available to you.
Take your shopping strategy to the next level with PriceLix
If everything we’ve covered sounds like a lot to track manually, you’re right. It is. That’s exactly why PriceLix exists.
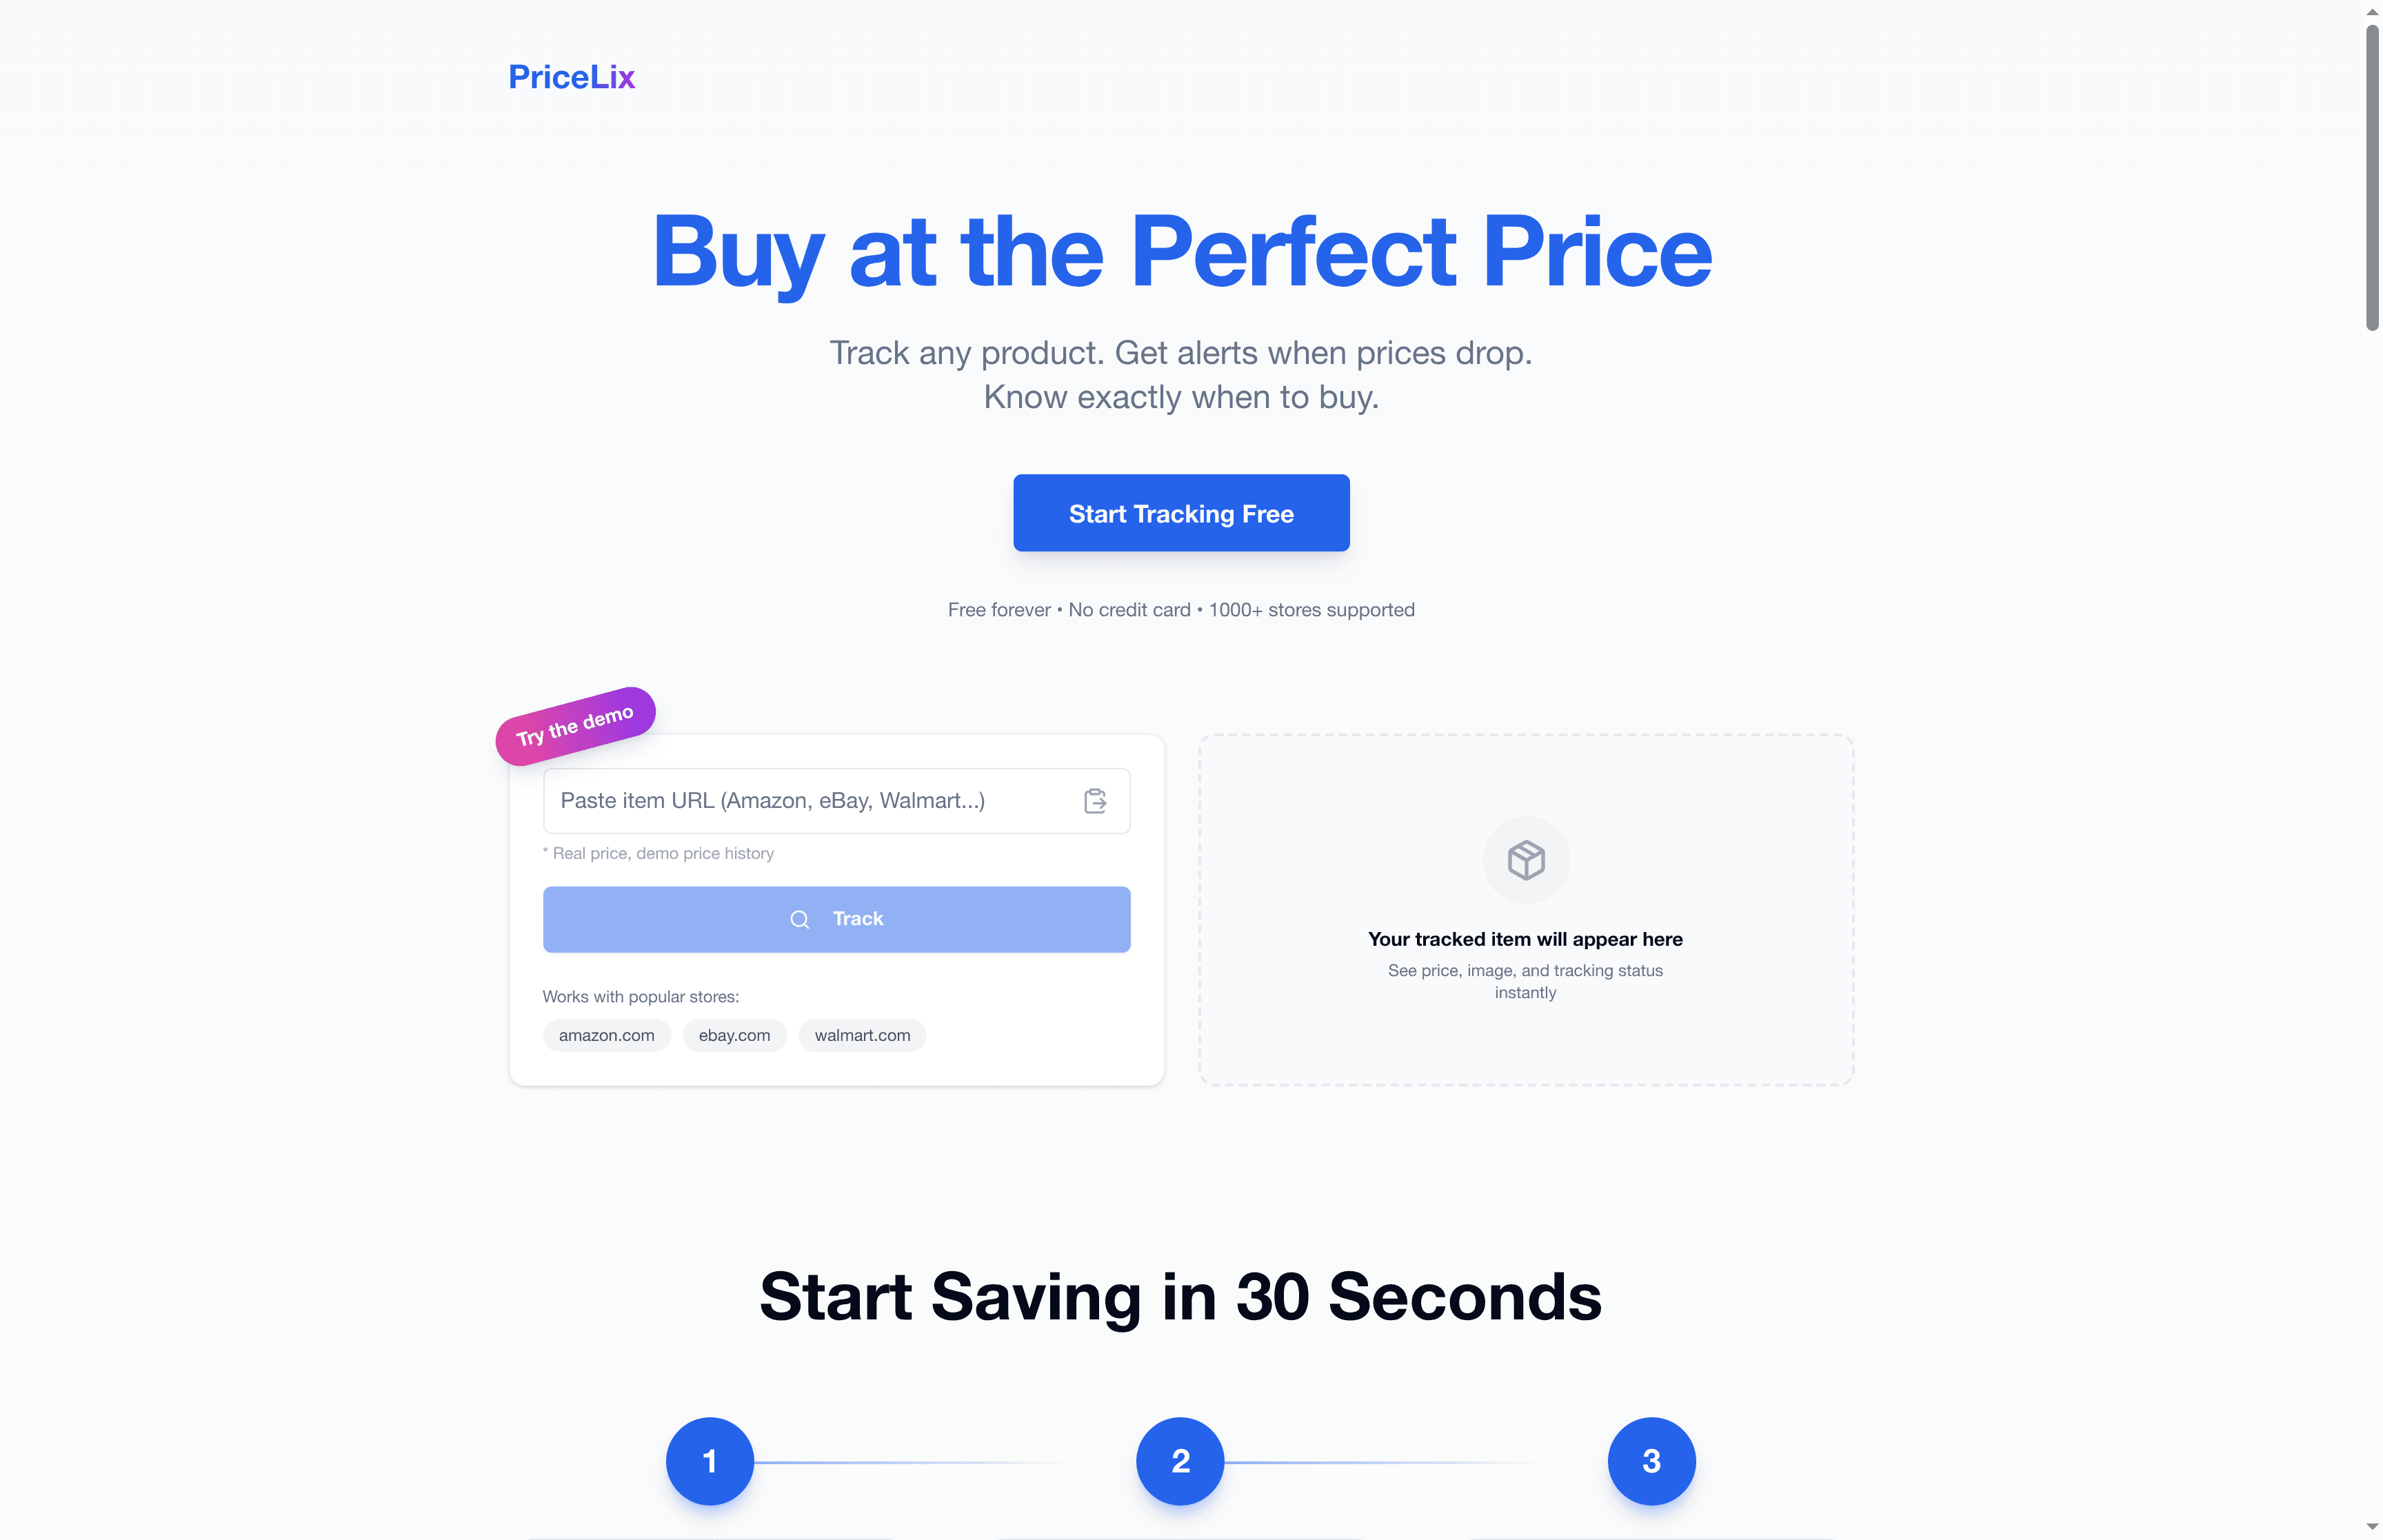
PriceLix automatically monitors prices across Amazon, eBay, Walmart, and over a thousand other retailers, giving you detailed price history charts and real-time alerts the moment a tracked item drops to your target price. No browser extensions required. No manual checking. Just a clean dashboard that keeps watch while you go about your day. Whether you’re timing a big holiday purchase, watching for a deal on a new gadget, or just making sure you never overpay for everyday items, start tracking smarter at PriceLix and turn price history from raw data into real savings.
Frequently asked questions
How can historical price data help me avoid overpaying?
Tracking historical price data lets you see if a current deal is genuine or just a temporary spike, so you can buy at the lowest price. Tools that track billions of products across multiple retailers make cross-retailer comparison easy and eliminate blind loyalty to a single platform.
Are price tracking tools always accurate?
Most tools accurately report listed price trends but can miss flash sales, coupons, or retailer-specific discounts. Lightning deals and on-page coupons are common blind spots, so double-checking directly on the retailer’s site before buying is always a smart move.
What’s the difference between dynamic and personalized pricing?
Dynamic pricing changes based on broad market factors like demand and competition, while personalized pricing adjusts based on your individual browsing behavior or profile. Both forms of pricing without transparency put the shopper at a disadvantage without the right tracking tools.
Can I rely on Amazon as the cheapest option for online shopping?
No single site is always cheapest, and cross-retailer comparison tools consistently show that prices vary significantly across platforms for the same product. Historical price tracking across multiple stores is the only reliable way to spot a true bargain.