
Smart shopping: what a price dashboard is and how it saves
TL;DR:
- Price dashboards provide real-time and historical pricing data to help shoppers make informed decisions.
- They collect data through web scraping, product matching, and normalization, displaying trends and alerts.
- Using dashboards prevents fake discounts, regional price differences, and enables post-purchase savings strategies.
Most shoppers assume the price they see online is the best price available. It isn’t. Online prices change hundreds of times a day across major retailers, and without the right tools, you’re essentially shopping blind. A price dashboard visualizes real-time and historical pricing data to support informed purchasing decisions. Think of it as your personal price watchdog, running quietly in the background while you get on with your life. In this guide, we’ll break down what a price dashboard actually is, how it works, which tools are worth your time, and how to avoid the traps that trip up even experienced bargain hunters.
Table of Contents
- What is a price dashboard?
- How price dashboards collect and display data
- Comparing popular price dashboard tools for online shopping
- Common pitfalls and advanced uses for price dashboards
- The bigger picture: why price dashboards are a game changer for smart shoppers
- Start tracking smarter with a price dashboard
- Frequently asked questions
Key Takeaways
| Point | Details |
|---|---|
| Price dashboards explained | They visualize current and historic prices so you can make smarter buying decisions. |
| Data collection mechanics | Dashboards gather price data from multiple sources and display it in easy-to-read charts and indices. |
| Tool comparison | Popular dashboards like CamelCamelCamel and Honey help you track deals and avoid fake discounts. |
| Advanced savings tips | Using dashboards after buying can help you claim refunds and even spot more savings opportunities. |
| Avoid common pitfalls | Be aware of inflated prices and mismatches; combine dashboard tools for the most accurate results. |
What is a price dashboard?
A price dashboard is more than a simple price checker. According to xByte Analytics, a price dashboard is a digital interface showing real-time and historical pricing data across products and retailers. It turns raw numbers into visual trends you can actually act on.
Think about the last time you bought something online. You probably checked one or two sites, saw a price, and either bought it or didn’t. A price dashboard changes that entire process. Instead of guessing, you see exactly what a product has cost over the past weeks, months, or even years. That context is everything.
There are two main types of price dashboards:
- Consumer-facing dashboards are built for shoppers like you. They track products on Amazon, Walmart, eBay, and similar platforms, showing price history charts and sending alerts when prices drop.
- Business-focused dashboards are designed for retailers and brands who need to monitor competitor pricing and adjust their own strategies. Tools in this space often include pricing dashboard intelligence features like elasticity modeling and competitive benchmarking.
For everyday shoppers, the consumer-facing type is what matters most. Here’s what a solid price dashboard typically includes:
- Real-time price updates across multiple retailers
- Historical price charts going back months or years
- Automated alerts when a tracked item drops to your target price
- Deal scores that rank how good a current price actually is
- Product matching across different sellers to find the lowest available price
The difference between buying on impulse and buying smart often comes down to one thing: knowing whether today’s price is actually a deal or just a retailer’s default markup dressed up as a discount.
Understanding how price comparison works is the foundation for using any dashboard effectively. Once you get it, you’ll never shop the same way again.
How price dashboards collect and display data
With dashboards defined, let’s see how they collect and turn raw data into actionable insights. The process is more sophisticated than most shoppers realize, and understanding it helps you trust the data you’re looking at.
Here’s how it works, step by step:
- Data scraping and API access. Dashboards pull price data from retailer websites using automated scrapers or official APIs. Major platforms like Amazon update prices frequently, so tools that rely on scraping and APIs for price accuracy check listings on a scheduled basis, often hourly or daily.
- SKU and product matching. A SKU (stock keeping unit) is the unique identifier for a product. Dashboards match the same product across different sellers using SKUs, barcodes, or product names to ensure you’re comparing apples to apples.
- Price normalization. Raw prices need to be adjusted for shipping costs, taxes, and currency differences before they’re useful. Normalization makes comparisons fair and accurate.
- Data visualization. Once cleaned and matched, prices are displayed as charts, trend lines, and deal scores. A chart showing an Amazon product’s price over 12 months, for example, instantly reveals whether a “sale” price is genuinely low or just average.
- Alert delivery. When a tracked price hits your target, the dashboard sends an email or push notification so you can act fast.
The result is a competitive price index that shows you where any given product sits relative to its own price history and competing sellers.
Here’s a practical example. Say you’re tracking a laptop on Amazon. The dashboard logs its price every day for a year. Over time, you see it spikes around product launch season and drops significantly in late November. That chart becomes gold. You know exactly when to buy.

Following best price tracking strategies and understanding the full price monitoring workflow helps you get the most out of this data. The tools do the heavy lifting. You just need to know how to read what they’re showing you.
Comparing popular price dashboard tools for online shopping
Once you understand the mechanics, you can choose the best tools for your needs. Not all dashboards are created equal, and the right one depends on where you shop and what you’re buying.
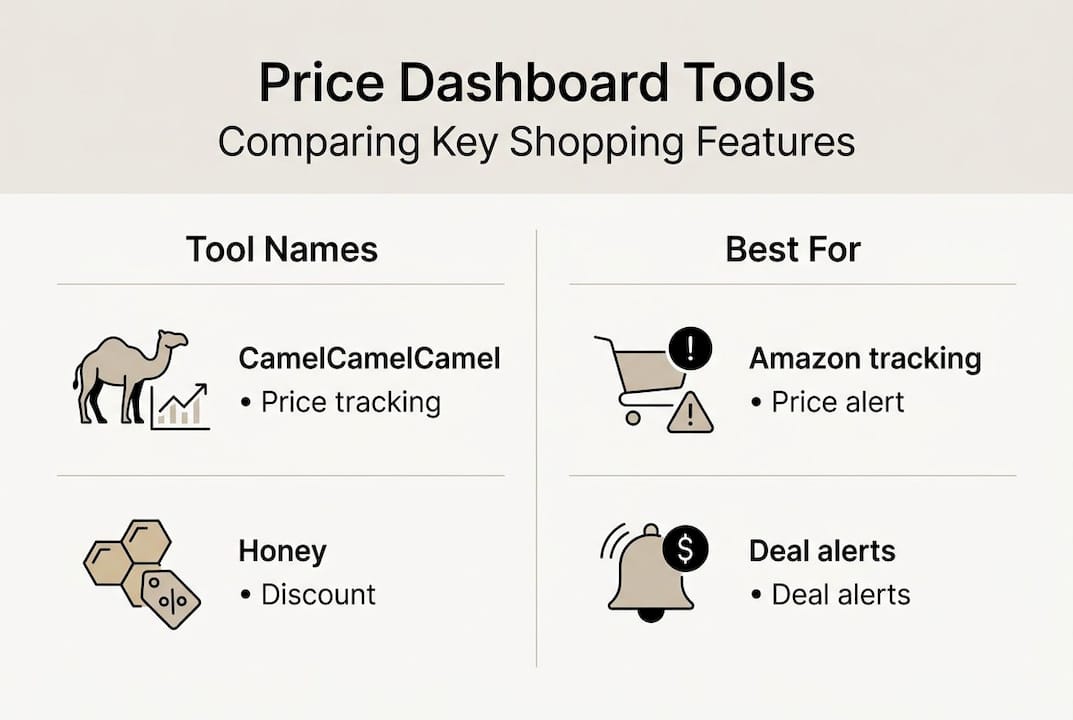
Tools like CamelCamelCamel, Honey, and PriceMirage aggregate prices, show history, and send deal alerts, but each has its own strengths.
| Tool | Best for | Retailers covered | Price history | Alerts |
|---|---|---|---|---|
| CamelCamelCamel | Amazon shoppers | Amazon only | Yes, years of data | Email alerts |
| Honey | Broad shopping | 30,000+ stores | Limited | Browser pop-ups |
| PriceMirage | Multi-retailer tracking | Multiple major stores | Yes | Email and app |
Here’s what makes each one stand out:
- CamelCamelCamel is the gold standard for Amazon price history. It’s free, reliable, and shows you years of price data in a clean chart format. If you shop Amazon regularly, this is non-negotiable.
- Honey is best for breadth. It covers an enormous range of stores and automatically applies coupon codes at checkout, which adds a layer of savings beyond price tracking alone.
- PriceMirage sits in the middle, offering multi-retailer tracking with solid alert functionality for shoppers who aren’t loyal to one platform.
Pro Tip: Don’t rely on just one tool. Use CamelCamelCamel for Amazon purchases and a broader tool like Honey for everything else. Combining dashboards gives you wider coverage and more chances to catch a genuine deal before it disappears.
For a deeper look at your options, check out our roundup of top price comparison apps and a full guide to online price comparison tools that can save you real money on every purchase.
Common pitfalls and advanced uses for price dashboards
Having chosen your tools, it’s crucial to spot pitfalls and discover advanced tricks for maximum savings. Price dashboards are powerful, but they can mislead you if you don’t know what to watch for.
The biggest trap is the fake discount. Retailers sometimes inflate a product’s “original” price before a sale to make the discount look bigger than it is. Without price history, you’d never know. With a dashboard, the manipulation is obvious.
Here’s a real-world comparison:
| Scenario | Listed “original” price | Sale price | Actual lowest price (from history) | Real savings |
|---|---|---|---|---|
| Fake discount | $199 | $149 (25% off) | $139 | You overpaid $10 |
| True deal | $199 | $149 (25% off) | $155 | Genuine savings |
Other pitfalls to watch out for:
- SKU mismatches. A dashboard might track a slightly different product variant (different color, bundle, or size) and show you a price that doesn’t apply to what you actually want.
- Regional pricing. Prices vary by location. A dashboard showing U.S. prices won’t reflect what shoppers in other regions pay, and even within the U.S., prices can differ by ZIP code.
- Edge cases like fake discounts, variant mismatches, and regional pricing all affect dashboard accuracy in ways that aren’t always visible at a glance.
How to avoid these traps:
- Always check the full price history chart before buying, not just the current price
- Verify the exact product variant being tracked matches what you want
- Cross-reference two or more tools before making a high-value purchase
- Follow price comparison best practices to sharpen your approach
Now for the advanced moves. Most shoppers use dashboards only before buying. That’s leaving money on the table. Post-purchase tracking is one of the most underused features available. If a product’s price drops within a retailer’s price protection window (often 30 days), you can request a refund for the difference.
Pro Tip: Set a price alert on any item you just purchased. If the price drops within the return or price protection window, contact the retailer for a partial refund. It takes two minutes and can save you real cash.
For a broader look at how to apply these strategies, explore the types of price tracking that work best for different shopping habits.
The bigger picture: why price dashboards are a game changer for smart shoppers
Here’s the contrarian take most shopping guides won’t give you: the real value of a price dashboard isn’t finding the lowest price before you buy. It’s changing how you think about pricing altogether.
Most shoppers treat deal hunting as a one-time event. You find a sale, you buy, you move on. But post-buy tracking and elasticity insights add value beyond regular deal alerts in ways that compound over time. Retailers know most people don’t check back after purchasing. That’s exactly why price protection policies exist but rarely get used.
Savvy shoppers leverage dashboards not just before, but after purchasing for refunds and long-term gains. It’s a mindset shift. You’re not just hunting for today’s deal. You’re building a smarter, ongoing relationship with pricing data.
There’s also the psychological angle. When you can see price history clearly, you stop feeling urgency from artificial “limited time” sales. That urgency is manufactured. The data proves it. Prices come back around. Knowing that can help you save up to 8 percent smartly just by waiting for the right moment instead of reacting to retailer pressure.
Dashboards don’t just save you money. They give you confidence. And that’s worth more than any single discount.
Start tracking smarter with a price dashboard
You now know what a price dashboard is, how it works, which tools to use, and how to avoid the pitfalls that catch most shoppers off guard. That’s a real edge.
The next step is putting it into practice. Try a price dashboard with PriceLix and start tracking products across Amazon, eBay, Walmart, and over a thousand other stores automatically. No browser extensions needed, no complicated setup. Just real-time alerts and price history charts that help you buy at the right time, every time. Pair that with our guide to tools to save money and you’ll have everything you need to shop smarter starting today.
Frequently asked questions
What data does a price dashboard track?
Dashboards aggregate current prices and history from multiple retailers and products, giving you a complete view of how a price has moved over time across different sellers.
Are price dashboards free for consumers?
Free tools like CamelCamelCamel and Honey cover most shoppers’ needs at no cost, though some platforms offer premium tiers with advanced features like deeper history or priority alerts.
How accurate are the price dashboard alerts?
Alerts are generally reliable, but 95%+ forecasting benchmarks apply mainly to enterprise tools. Consumer tools can be affected by SKU mismatches or temporarily inflated “original” prices used to fake discounts.
Can dashboards help after you’ve bought a product?
Absolutely. Post-purchase tracking adds value by alerting you when a price drops within a retailer’s price protection window, giving you a chance to claim a partial refund.
Do price dashboards work for all retailers and regions?
Regional pricing and SKU mismatches affect coverage, so while most major global retailers are supported, smaller regional stores or location-specific pricing may not always be captured accurately.